Housing demand
More of this shit

One of my favorite targets of ire is, obviously, the simplistic, sub-classical notion of supply and demand that predominates in housing discussion. Of course, there is plenty of “data” showing that there is in fact a shortfall in housing completes nationally, the most widely used hailing from the venerable Freddie Mac – meaning, ultimately, that supply is not matching consumer demand (whatever that means in this context). But, of course, one should never trust a graph or table. Let’s take a bit of a look at what Freddie is doing here.
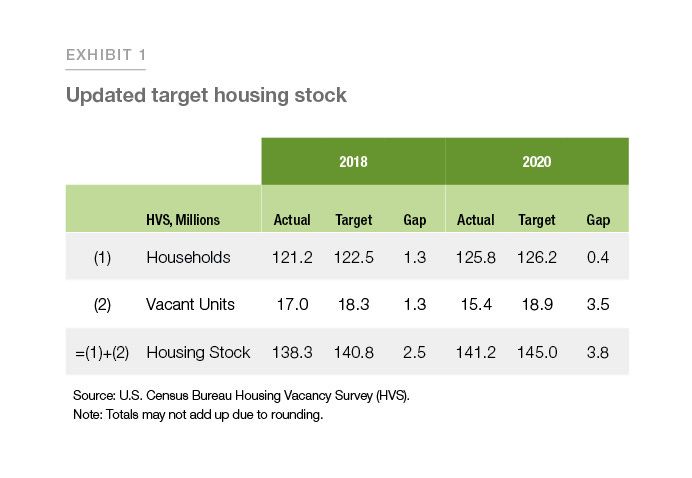
This is Exhibit 1 from the Research Note linked above. Freddie Mac starts with household data from the US Census Housing and Vacancy Survey (HVS). “Household formation” is actually the essential concept (FRED graph here), and is found via survey and then weighted to housing units, not to population. The definition of a household is rather shifty, because what is really being counted is the existence of a person with “headship” status (meaning head of household). Thus, a household may be composed of one person or of many, and further, many headship-status persons may live together in a single unit as roommates. As Daniel Garcia and Andrew Paciorek remark in a recent research note from the Federal Reserve, headship and thus household formation is up after a pandemic slackening. Obviously, the headship rate is extremely volatile and tethered to recessions (what isn’t?) but also the labor market and inflation in housing costs and other CPI items. It isn’t a reading of any particular insight, given as it is so dramatically affected by “exogenous” elements and personal caprice and fortunes, but nevertheless remains a fine enough place to start.
To return for a moment to what it means for the household formation data to be weighted to housing units: the CPS/HVS household number being weighted to housing really means it is weighted to vacancy. Particularly, there is an original assumption that HVS surveys correctly identify all vacancies with in-person visits and further that residents do not refuse to answer the survey, according to the HVS methodology available here. This means that there is a potential for severe distortions in the vacancy rate in the event of a refusal or otherwise failed attempt to accurately identify occupancy status. And since, in the end, the measure of occupied households nationally is infilled to match the number of households remaining of the total after finding the estimated vacancy rate, we are left with a measure that is ultimately found in the negative: vacancies are found first and then households are what’s “left over” to achieve parity with the total.
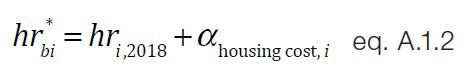
Anyway, that’s what we’re starting with. FRED has the number of households for March 2022 at 127,410,000 nationally. This is the crucial number, according to the prevailing neoclassical logic, and communicates real information to the construction industry and homesellers with respect to expected demand. Andrew Paciorek, writing elsewhere for the Federal Reserve, “fewer new households formed has meant less demand for houses, leading to persistently low house prices and, in turn, a slump in new residential construction”. Freddie builds from this reasoning, but curiously begins with different numbers, notably the ASEC headship total, which skews a bit higher as it is not weighted and is more directly reported. For March 2020, the ASEC headship number was a million over the CPS/HVS number, coming in at 128.4 million. This number is then “adjusted” for “housing costs, income, and employment” (I couldn’t quite find out how). From here, Freddie goes a step further to arrive at a “Target Households” number by decomposing “the factors affecting household formation” (the adjustments seen above), and adding the housing costs decomposition back to the actual household number based on the assumption “that housing costs become more favorable for household formation”. See below (from a 2018 article, ignore that).
So basically, beginning with an ambiguously inflated total for headship, Freddie proceeds to increase that total further.
From here, Freddie assumes a 13% vacancy rate nationally “estimated to ensure that there is a well-functioning housing market, which requires some vacant properties for sale and for rent”. So, another illusory number, and one which would be a hard sell to a developer: “you have to build in order to keep the market flowing and just accept the loss”. The current vacancy rate (or the rate for Q42020 anyway) is 10.9%, by the way. So this 13% number comes out to 18.9 million units required above the estimated target rate.

k* is the estimated target housing rate, hh* target households, and v* target vacancy rate. For the latest calculation, hh* = 126.2 million, and v*, as I said, is 13%. This gives us a k* of 145,057,471 for the ideal size of existing national housing stock. The latest housing stock estimate from HVS is then subtracted (141.2 million as of Q42020) to arrive at a “housing gap” of 3,857,471 houses. This number is then taken to imply an “effective demand”, despite not actually measuring demand whatsoever – this is an idealization of targets and estimations which is then turned around and presented otherwise.
Freddie’s economists go on to explain away housing slumps as a failure on the part of homebuilders to build “starter homes”, which it defines as homes under 1,400 SF, which would aid in further increasing household formation by furnishing “entry-level units” to newly formed households. Of course, here is another distortion, as it avoids the actual costs of homeowning by wriggling around the existence of mortgages as the actual prohibitive cost while simultaneously imagining that smaller homes are always cheaper (yes, real estate’s commodity is finished square feet, but there are many modifications of the price per SF number in accordance with the geolocational uniqueness of landed property). Here we arrive at another curious feint: in one sense, contractors are expected and imagined to operate with perfect information pertaining to demand, but on the other are critically failing to provide houses for a market which, we are told, is crying out for the opportunity to buy. The claim that sub 1,400 SF houses function as an “entry-level” supply seems quite odd, also; instead of claiming affordability can be achieved by adjustments of mortgage rates, for example, there is first the assumption that smaller is universally cheaper, and then that the disappearance of smaller homes is somehow a move against affordability when it is in fact precisely due to the fact that the majority of new builds occurs in suburban and exurban settings on larger lots (see the Census data here, particularly page 7, to see the massively larger amount of residential completes in the less-densely urbanized US South and West regions). At the same time, smaller units are assuredly not cheaper; they are, on the whole, concentrated in urban areas, due to the obvious premium on space.
Anyway. Have a good Friday everyone.